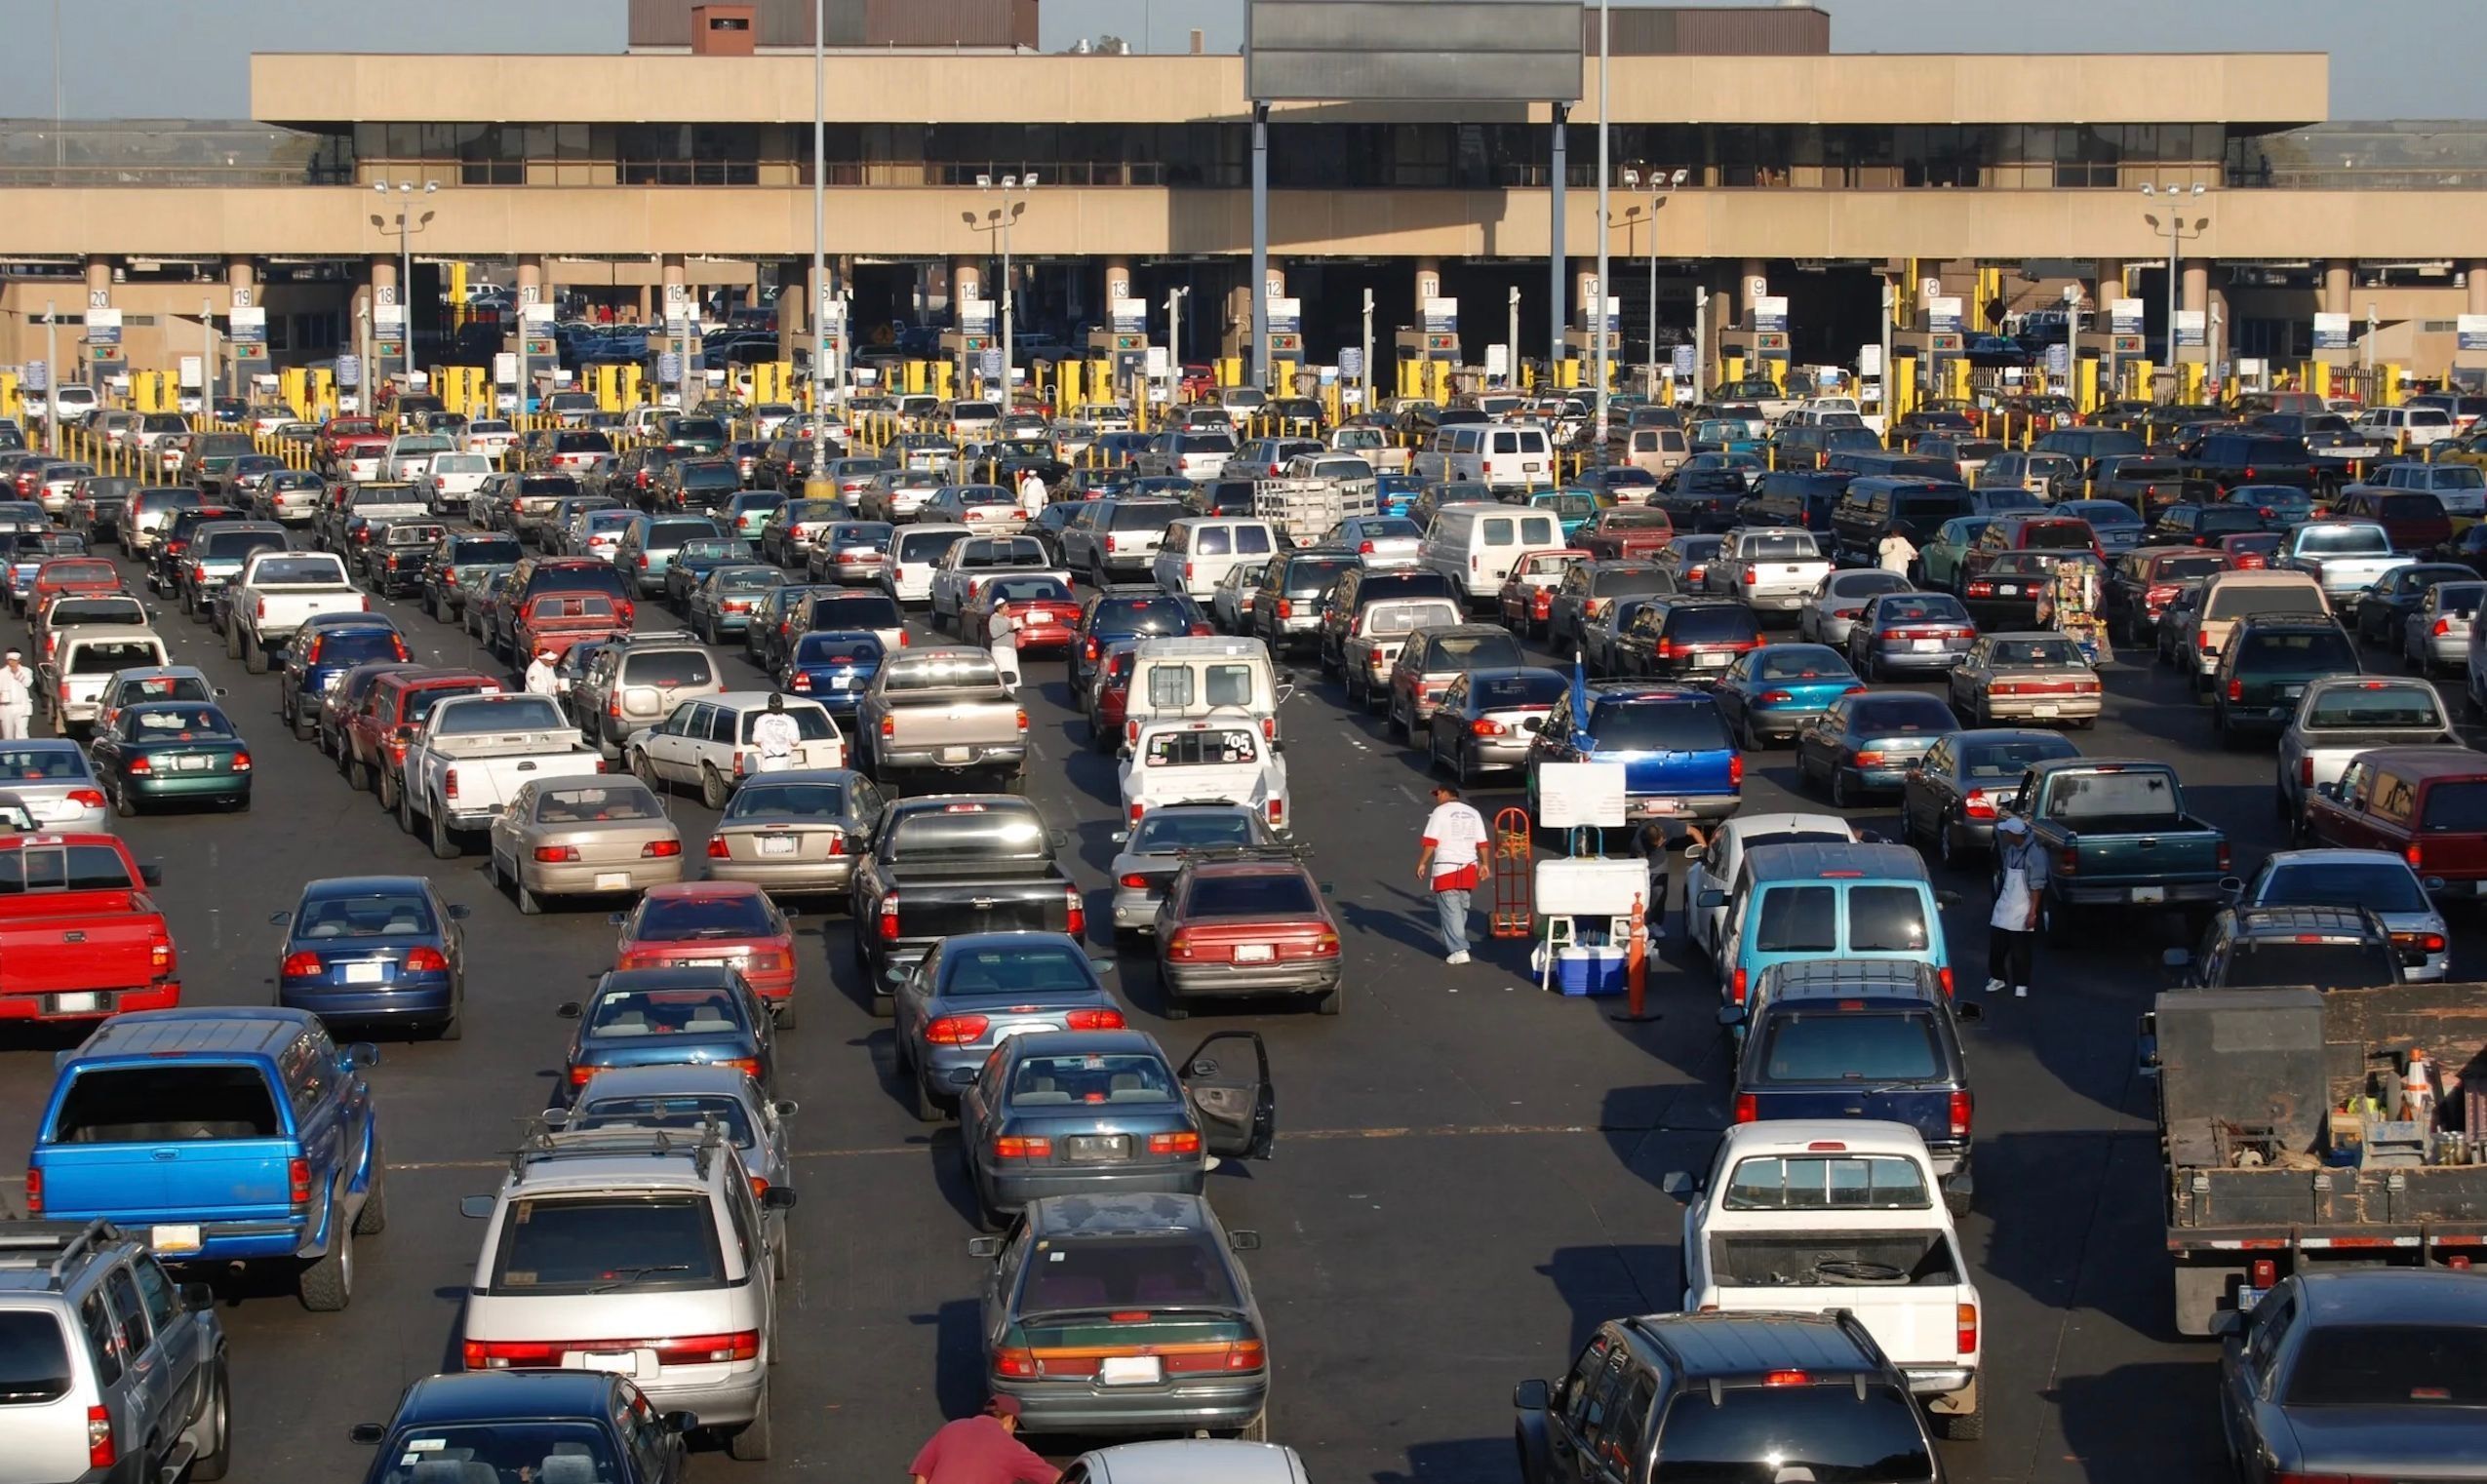
San Ysidro Port of Entry
Office of Health and Hazard Assessment
Hundreds of cars cross the United States southern border at the San Ysidro Port of Entry.
CalEnviroScreen is a mapping tool that has become the shining example for how to best track where inequity and environmental injustice meet. A look back at how the CalEPA set an international standard for determining where the most need for environmental action is.
In 1999, California passed Government Code 65040.12, defining environmental justice as “the fair treatment of people of all races, cultures, and incomes with respect to the development, adoption, implementation, and enforcement of environmental laws, regulations, and policies.” CalEnviroScreen, a mapping tool aimed at improving the California Office of Planning and Research’s ability to focus environmental justice efforts where they are most necessary, was passed into law by the California Senate as part of Senate Bill 535 (SB535) in 2012. One year later, the program was released by the California Environmental Protection Agency (CalEPA) and the Office of Environmental Health Hazard Assessment (OEHHA).
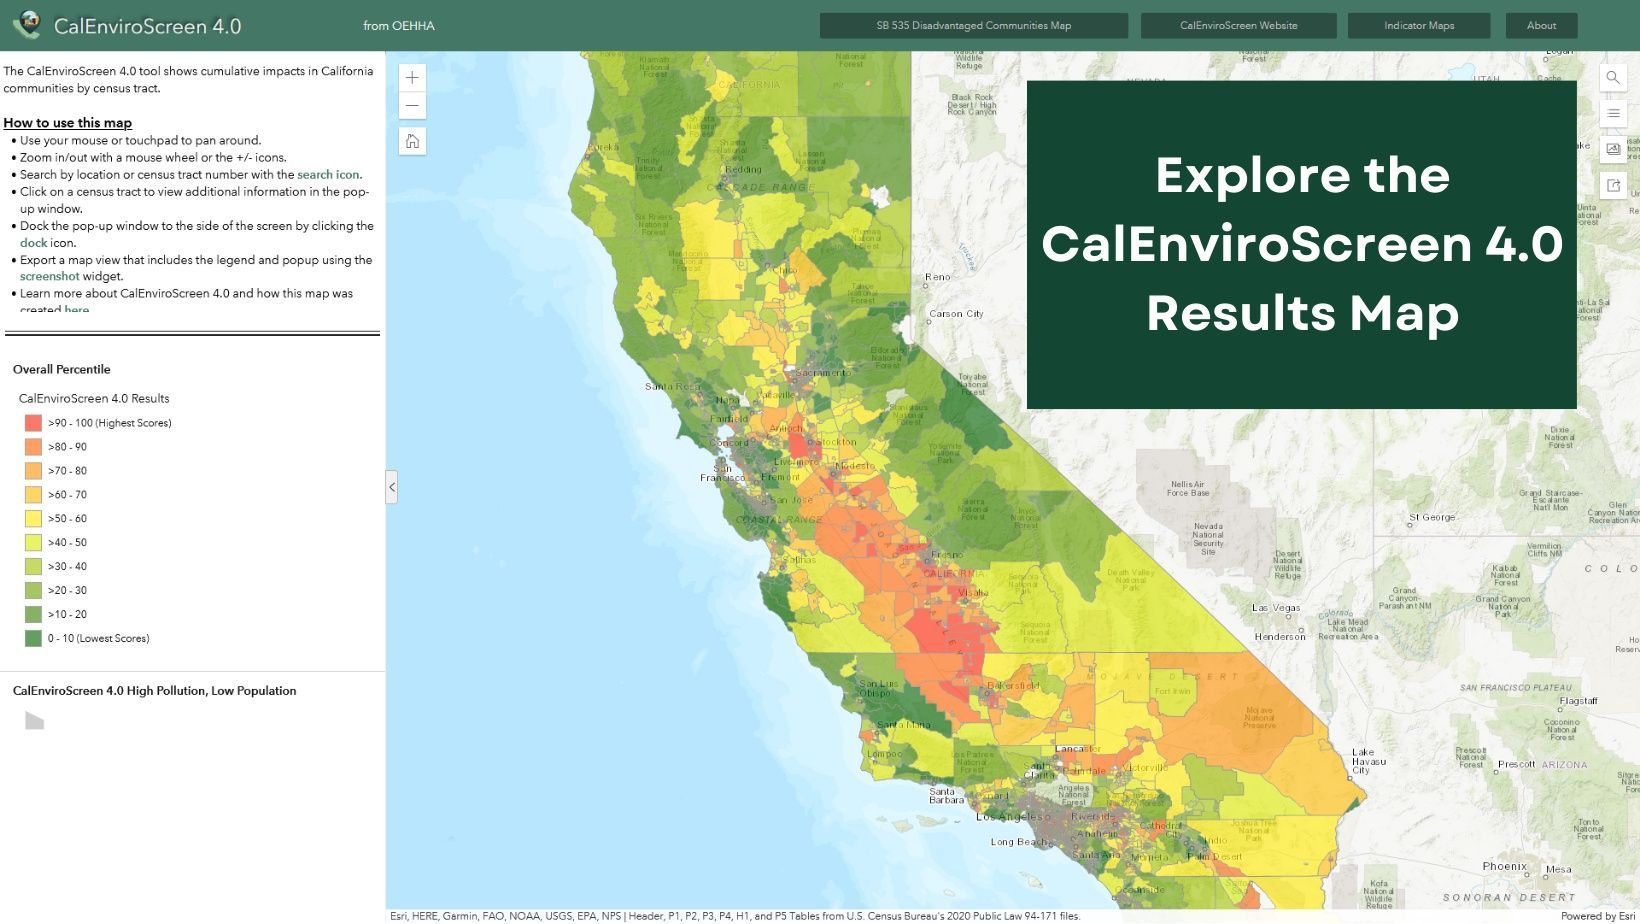
CalEnviroScreen 4.0 Results
CalEnviroScreen 4.0
A complete, interactive map of CalEnviroScreen 4.0 results. Locales are scored according to the census tract they are a part of.
CalEnviroScreen 4.0 Results
CalEnviroScreen 4.0
A complete, interactive map of CalEnviroScreen 4.0 results. Locales are scored according to the census tract they are a part of.
CalEnviroScreen is designed as a tool for California to meet community needs all across the Golden State. The mapping software is invaluable in identifying locales where multiple sources of pollution and poverty intersect, limiting California’s susceptibility to a growing divide between impoverished and affluent areas within the state. It allows California to implement policy and investment in ways that align with the principles of environmental justice laid out by CalEPA’s Environmental Justice Program. Their webpage asserts that these “principles of environmental justice call for fairness... and the meaningful involvement of community in the development of laws and regulations” affecting “the places that people live, work, play, and learn.”
“The tool has focused environmental protection and enforcement actions by combining... data sources... [highlighting] communities living at the intersection of pollution and poverty,” according to the CalEPA and the OEHHA’s tenth anniversary webpage. CalEnviroScreen has helped “direct over six billion dollars in California climate investments” using input from scholarship, science, community, and industry-based organizations, tribal representatives and the environmental justice “community members [that] helped shape CalEnviroScreen and have continued collaborating with OEHHA to improve it.”
The mapping software has seen four versions since its creation. Through a continued focus on the program’s improvement, “CalEnviroScreen has become the national gold standard of mapping tools capable of driving more equitable decision-making,” Yana Garcia, Secretary for Environmental Protection at CalEP, remarked on the program’s tenth anniversary webpage. Garcia notes that CalEnviroScreen highlights “communities [facing] environmental injustices... allowing California to focus our efforts and investments where they are needed most.” Arsenio Mataka, Counselor to the Secretary at the US Department of Health and Human Services, emphasizes that “over the past ten years, [the mapping tool] has demonstrated that there is everlasting power when lived experiences are validated by data.”
Consistent engagement with communities across California is the key to the CalEnviroScreen program’s success. Data gathered by CalEnviroScreen is incomplete without real-world data to verify the information collected. To fill these gaps, the CalEPA collaborates with local communities throughout California to ensure that Californians get the most out of CalEnviroScreen.
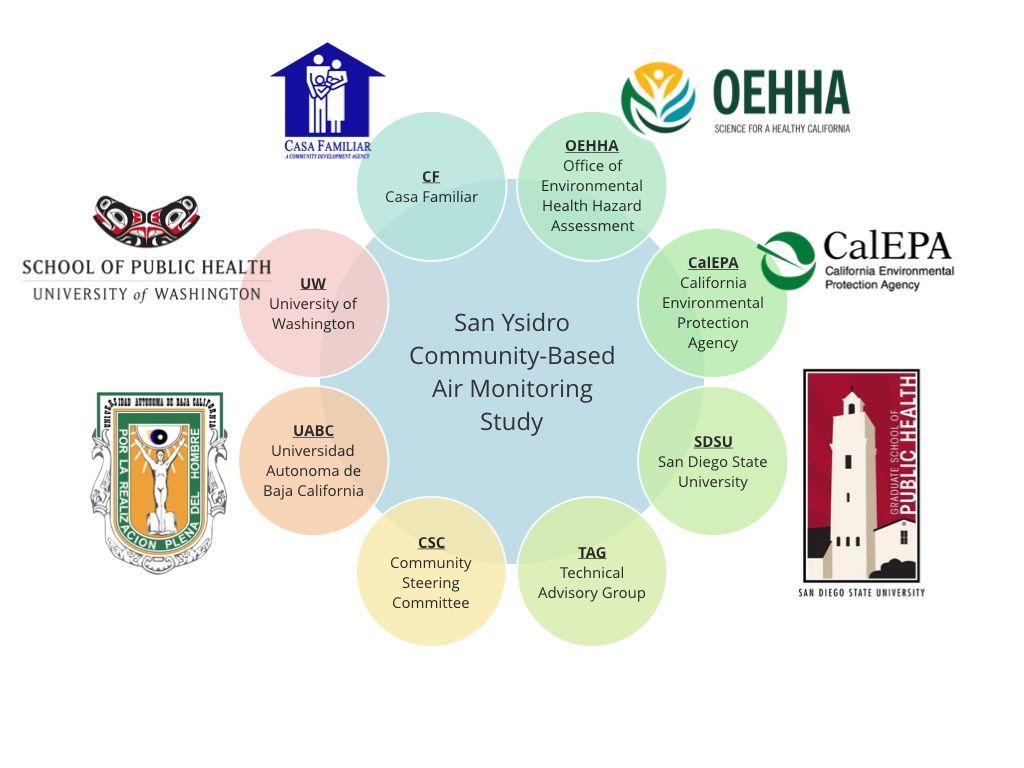
San Ysidro Air Study partner institutions, groups, and agencies.
Department of Environmental and Occupational Health Sciences at the University of Washington
List of partner institutions that played a part in conducting the San Ysidro Air Study.
San Ysidro Air Study partner institutions, groups, and agencies.
Department of Environmental and Occupational Health Sciences at the University of Washington
List of partner institutions that played a part in conducting the San Ysidro Air Study.
Groundtruthing data from community-based projects like the San Ysidro Air Study, the OEHHA explains, is a “[two] year collaboration between the San Ysidro Community, state government, and academia to collect neighborhood air pollution data using advanced low-cost technology,” and are essential in improving “the accuracy of border-region data” collected by CalEnviroScreen. As used here, border-region data refers to data gathered to determine the impacts of air pollution in San Ysidro, a community with a high rate of border-crossing traffic. California’s continued focus on the betterment of the program is fundamental to its status as an international gold standard for environmental justice mapping tools.


